< 월별/일별 그래프 구현 >

1. chart.js 라이브러리 추가
<script src="https://cdnjs.cloudflare.com/ajax/libs/Chart.js/2.6.0/Chart.js"></script>2. 그래프 위치 <div></div>
<div class="row" id="chart">
    <div class="col-8 col-md-6">
        <div class="yearChart">
            <canvas id="canvasYear"></canvas>
        </div>
    </div>
    <div class="col-4 col-md-6">
        <div class="monthChart">
            <canvas id="canvasMonth"></canvas>
        </div>
    </div>
</div>
3. 자바스크립트
- chartLabels -> 차트 가로 항목(월/일), chartData -> 가로 항목별 매출액을 담을 변수를 선언한다.
- ajax로 비동기 실행 url: "<%=context%>/yearIncome",
<script type="text/javascript">
	var year = $('#Ayear').val();
	var month = $('#Amonth').val();

	//alert("첫번째");
	var chartLabels = [];
	var chartData   = [];

	//일별 합계
	$.ajax({
	    url: "<%=context%>/yearIncome",
	    data: {year : year, month: month},
	    dataType: "json",
	    success: function (data) {

		}
	});


</script>
4. Controller -> 리턴 값을 json 형식으로 넘겨주어야 함!
    @ResponseBody
    @RequestMapping(value = "yearIncome", produces = "application/text;charset=UTF-8")
    public String yearIncome(YearIncome incomeVO,  Model model) {
        System.out.println("yearIncome 컨트롤러");
        int month = incomeVO.getMonth();
        int year  = incomeVO.getYear();

        System.out.println("month : " + month + "year : " + year );
        Gson gson = new Gson();
        List<YearIncome> yearList = incomeService.yearIncome(incomeVO);

        System.out.println("yearList.size() : "  + yearList.size());
        return gson.toJson(yearList);
    }
@Data
public class IncomeVO {
private int incomedate;
private int tot;
//조회용
private int year;
private int month;
private int lastday;
}
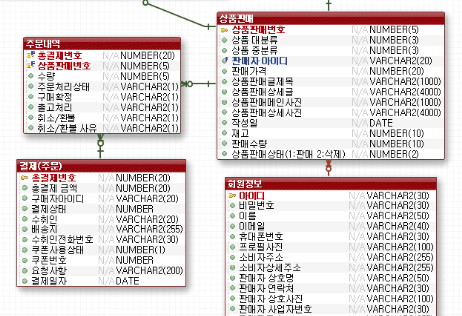
5. 각각 매출액을 조회하기 위해서 쿼리를 작성해야하는데, 주문내역/결제/상품판매 3개의 테이블을 조인해야함.
- 1) 결제(주문) : 총 결제 -> 결제일자
- 2) 주문내역 : 1)의 세부내역. 판매자가 다를 수 있음. -> 상품판매번호/ 수량
- 3) 상품판매 : 상품 정보 -> 판매자 아이디, 판매가격

	<select id="mjMonthIncome" parameterType="MonthIncome" resultType="MonthIncome">
		<![CDATA[
			select b.rn as incomedatem, nvl(a.income, 0) as totm
              from (select to_char(pay_date, 'dd') as dd, sum(pay_tot) as income
                      from payment
                     where to_char(pay_date, 'yyyy') = #{year}
                       and to_char(pay_date, 'mm') = #{month}
                     group by to_char(pay_date, 'dd')) a,
                   (select rownum rn from dual connect by level <= #{lastday}) b
             where a.dd(+) = b.rn
             order by b.rn
		]]>
	</select>
느낀점 -> 테이블 설계시 정말 많은 생각과 고민을 해야겠다. 안그러면 나중에 골치아프다!!!!!
6.다시 자바스크립트로와서 success 함수 실행됨.
<script type="text/javascript">
	var year = $('#Ayear').val();
	var month = $('#Amonth').val();

	//alert("첫번째");
	var chartLabels = [];
	var chartData   = [];

	//일별 합계
	$.ajax({
	    url: "<%=context%>/yearIncome",
	    data: {year : year, month: month},
	    dataType: "json",
	    success: function (data) {
			$.each(data, function (inx, obj) {
				chartLabels.push(obj.incomedatey);
				chartData.push(obj.toty);
			});
			createYearChart();
			console.log("createYearChart")
		}
	});

	var lineChartData = {
			labels :chartLabels,
			datasets : [
				{
					label : "월별합계",
					fillColor : "#1c3316",
					strokeColor : "#5d6d68 ",
					pointColor : "#b0d282",
					pointStrokeColor : "#f4f1e9",
					pointHighlightFill : "#f4f1e9",
					pointHighlightStroke : "#a6d377",
					data : chartData
				}

			]
	}

	function createYearChart(){

		let ctx = document.getElementById("canvasYear").getContext("2d");

		let barChart = new Chart(ctx, {
			type : 'bar',
			data : lineChartData
		})
	}


	var year = $('#Ayear').val();
	var month = $('#Amonth').val();

	//alert("두번째");
	var chartLabels2 = [];
	var chartData2   = [];

	//일별 합계
	$.ajax({
	    url: "<%=context%>/monthIncome",
	    data: {year : year, month: month},
	    dataType: "json",
	    success: function (data) {
			$.each(data, function (inx, obj) {
				chartLabels2.push(obj.incomedatem);
				chartData2.push(obj.totm);
			});
			createMonthChart();
			console.log("createMonthChart")
		}
	});

	var lineChartData2 = {
			labels :chartLabels2,
			datasets : [
				{
					label : "일별합계",
					fillColor : "#b0d282",
					strokeColor : "#b0d282",
					pointColor : "#b0d282",
					pointStrokeColor : "#a6d377",
					pointHighlightFill : "#a6d377",
					pointHighlightStroke : "#a6d377",
					data : chartData2
				}

			]
	}

	function createMonthChart(){

		let ctx2 = document.getElementById("canvasMonth").getContext("2d");

		let barChart2 = new Chart(ctx2, {
			type : 'bar',
			data : lineChartData2
		})
	}
</script>
* chart.js는 막대형 그래프 이외도 다양한 형태의 그래프를 제공해주는 라이브러리이다.
결과값만 잘 받아오면 원하는 모양으로 꾸밀 수 있다!
Chart.js | Open source HTML5 Charts for your website
New in 2.0 New chart axis types Plot complex, sparse datasets on date time, logarithmic or even entirely custom scales with ease.
www.chartjs.org
'프로젝트 > project' 카테고리의 다른 글
| [IntelliJ]서버 재시작 없이 정적리소스 반영 (0) | 2022.09.06 |
|---|---|
| [spring] 문의하기 구현 (0) | 2022.09.01 |
| [spring]sweetalert으로 Alert 구현 (0) | 2022.09.01 |
| [JSP]네이버 지도 API (0) | 2022.08.30 |
| [JSP] 인스타 좋아요 기능 구현 (0) | 2022.08.29 |
